
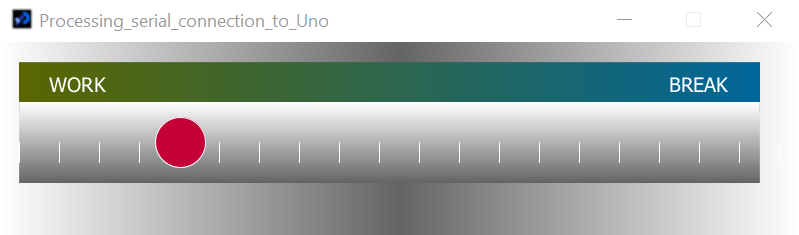
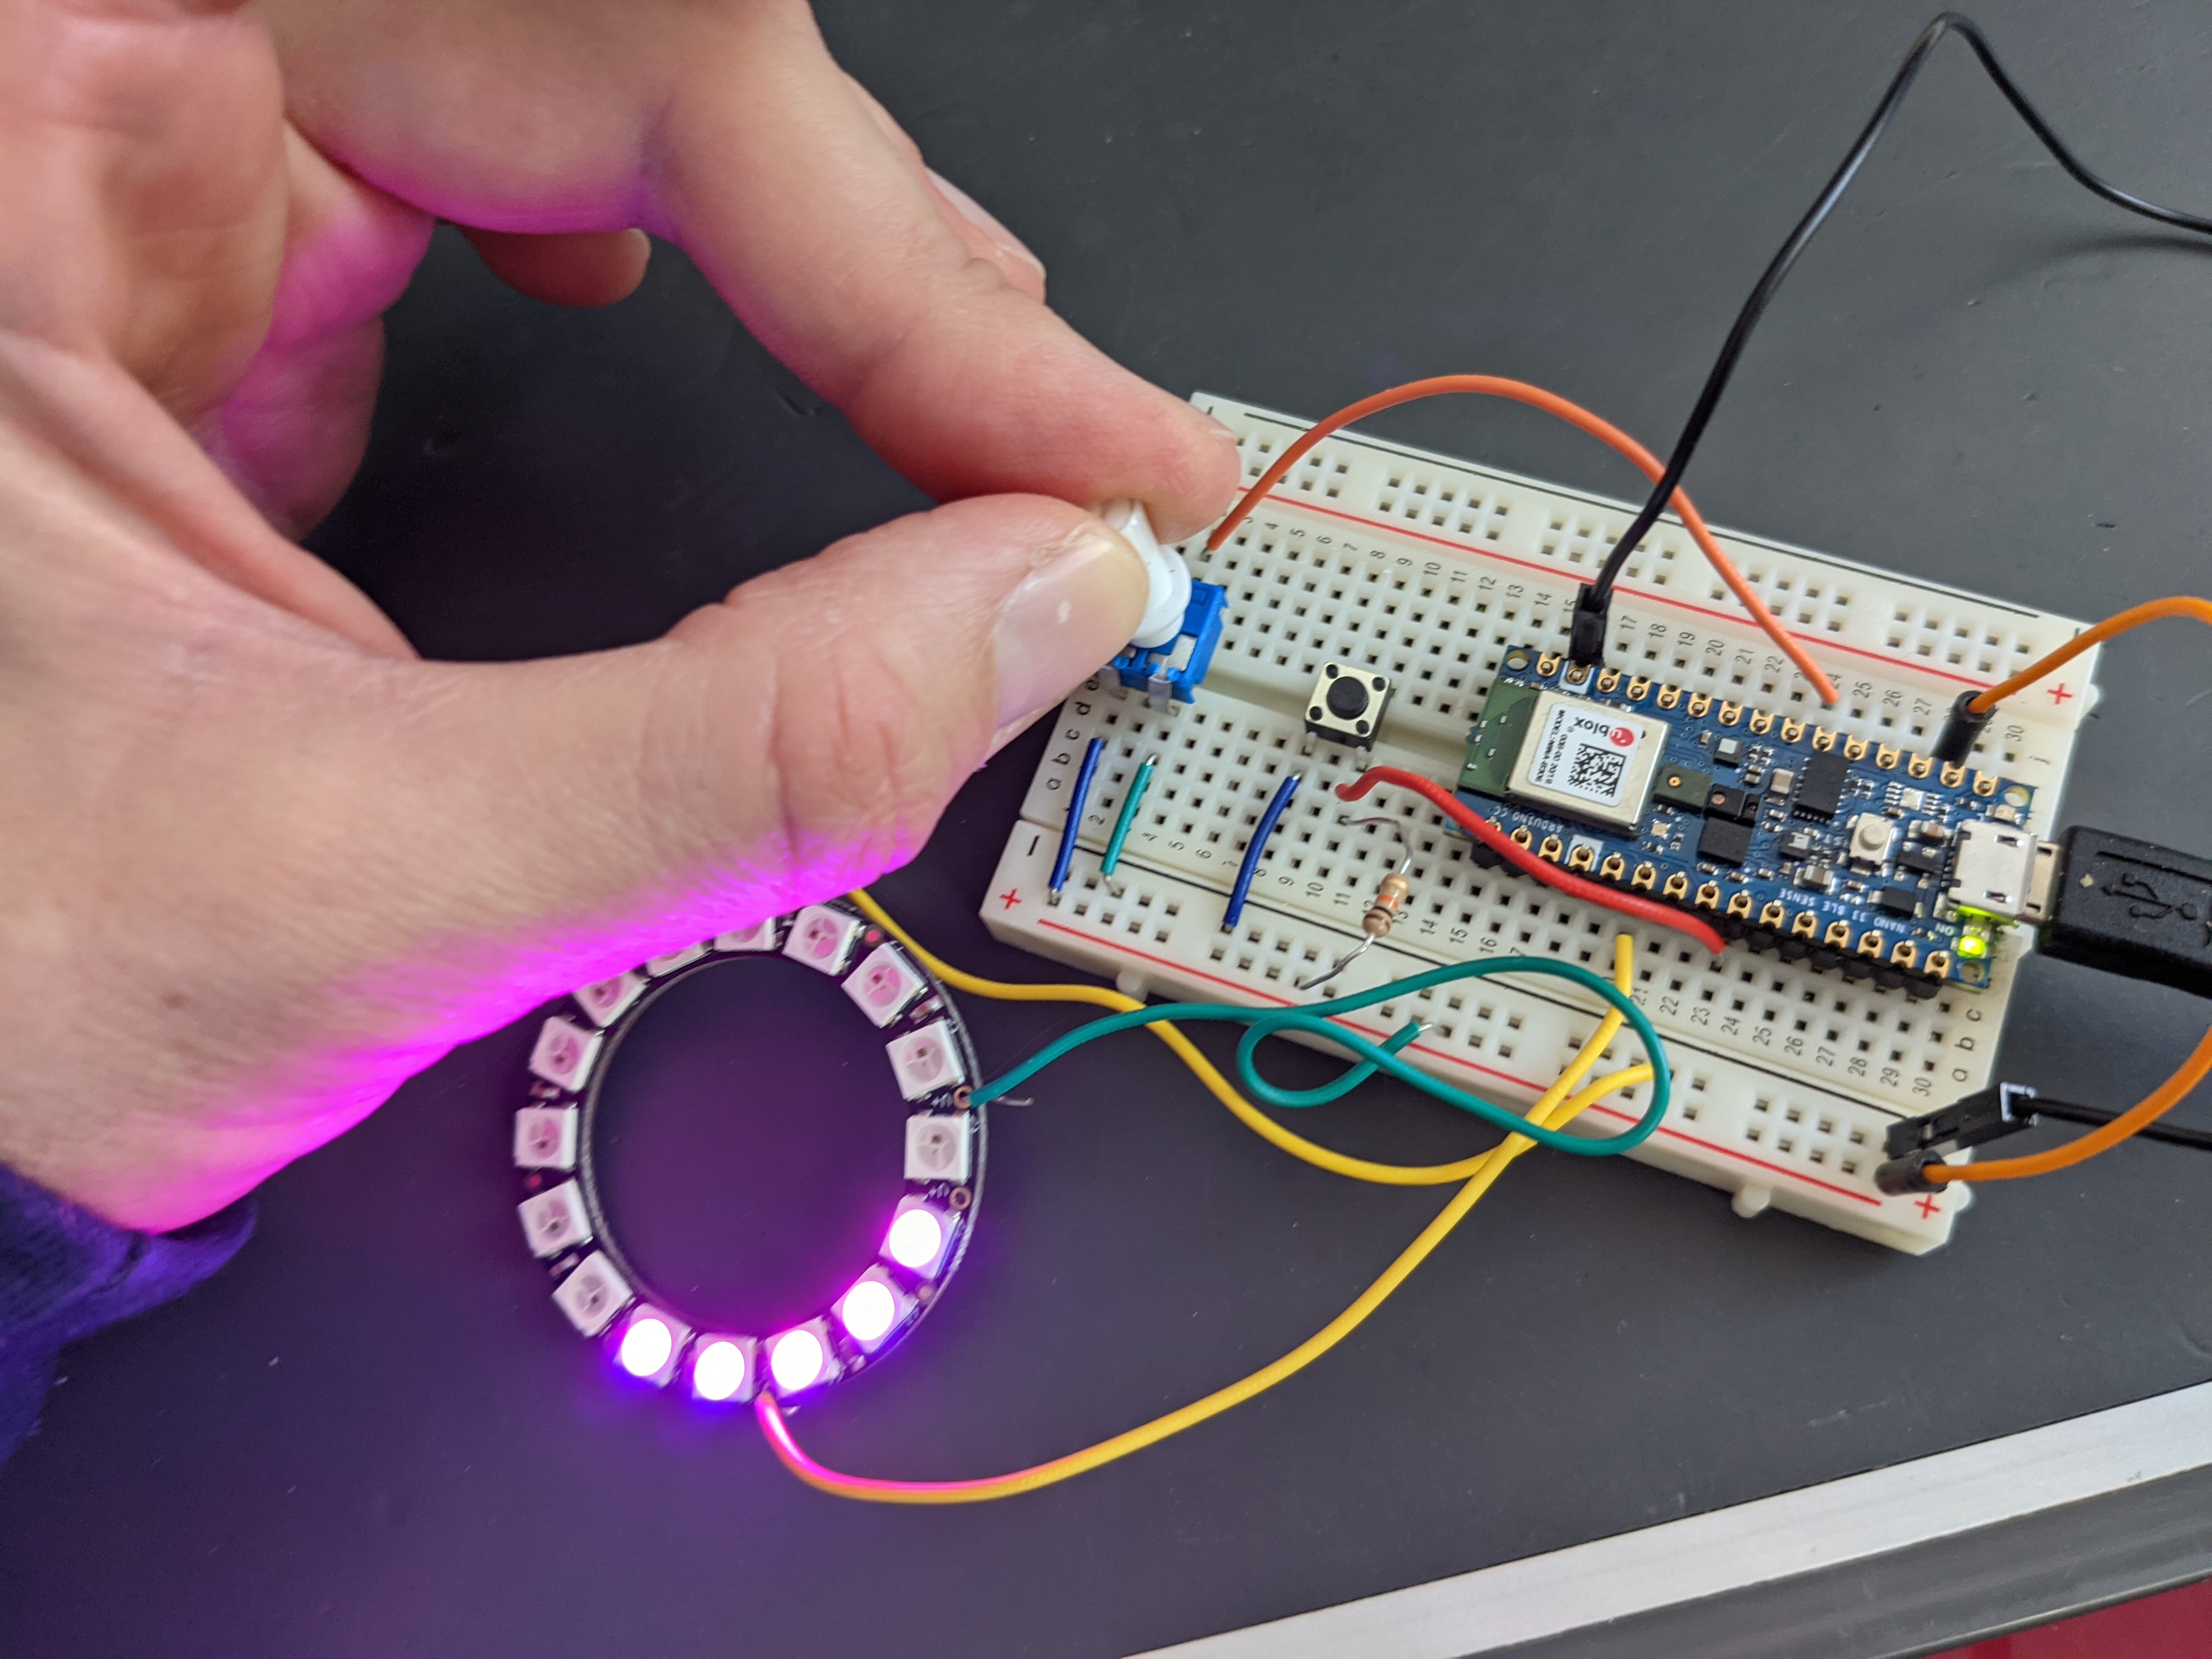
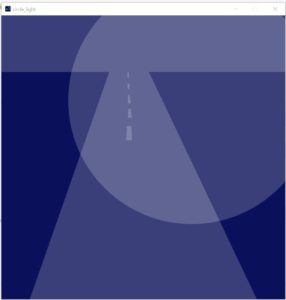
Creating a visual display on the computer using Processing to read a value from the counting loop on the Arduino and visualize that as a metric of time worked. The example code from the Arduino starter kit was perfect for this test, as it provides a simple counting state machine to advance the timer – that that value also seemed to make a good parallel indicator in Processing for the monitor mapping.
The circle also changes from red to blue as it advances along the scale to encourage the break.
Next Steps
Modify the code to work on a Circuit Playground Bluefruit and send the data via Bluetooth to the computer to provide a wireless experience.
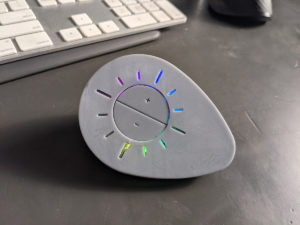
I might make the indicator an egg shape to carry through the visual from the physical form – it’s cheezy, but why not?
I’d also like to see if I can add a reset button to the Processing sketch and have it pass that back through to the Arduino.
Also trying to get the more exciting fonts to work in the Processing sketch – Not sure if it’s the true type fonts on my computer causing the issue or if they have to be in a subset defined somewhere.
import processing.serial.*;
Serial arduinoConnection;
int sensor = 0;
int Y_AXIS = 1;
int X_AXIS = 2;
color b1, b2, c1, c2;
void setup() {
  println( arduinoConnection.list() );
  size( 800, 200 );
  textFont(createFont("Tahoma", 36));
  arduinoConnection = new Serial(this, Serial.list()[1], 9600);
    // Define colors
  b1 = color(255);
  b2 = color(100);
  c1 = color(90, 102, 0);
  c2 = color(0, 102, 153);


}
void draw() {

  // Background
  setGradient(0, 0, width/2, height, b1, b2, X_AXIS);
  setGradient(width/2, 0, width/2, height, b2, b1, X_AXIS);
  // Foreground
    setGradient(20, 20, 740, 50, c1, c2, X_AXIS);
      setGradient(20, 60, 740, 80, b1, b2, Y_AXIS);

    textSize(20);
      fill( 255 );

  text("WORK", 50, 50);
  text("BREAK",670,50);

  float x = map( sensor, 0, 22, 0, width ); // change to fit your sensor values
  float b = map( sensor, 0, 22, 0, 255 );
  fill( 255-b, 0, b );
  circle( x, height/2, 50 );

}
void serialEvent(Serial port) {
  try {
    String data = port.readStringUntil('\n');
    if ( data != null ) {
      data = trim(data);
      if ( data.isEmpty() == false ) {
        //println(data);
        sensor = Integer.parseInt(data);
      }
    }
  } catch(Exception ex) {
    // handle the error
    println(ex);
  }
}
void setGradient(int x, int y, float w, float h, color c1, color c2, int axis ) {

  noFill();

  if (axis == Y_AXIS) {  // Top to bottom gradient
    for (int i = y; i <= y+h; i++) {
      float inter = map(i, y, y+h, 0, 1);
      color c = lerpColor(c1, c2, inter);
      stroke(c);
      line(x, i, x+w, i);
    }
  }
  else if (axis == X_AXIS) {  // Left to right gradient
    for (int i = x; i <= x+w; i++) {
      float inter = map(i, x, x+w, 0, 1);
      color c = lerpColor(c1, c2, inter);
      stroke(c);
      line(i, y, i, y+h);
    }
  }
  for(int n = 20; n < width; n += 40) {
  // If 'i' divides by 20 with no remainder draw
  // the first line, else draw the second line
  if((n % 20) == 0) {
    stroke(255);
    line(n, 120, n, height/2);
  } else {
    stroke(153);
    line(n, 90, n, 180);
  }
}
}